Despite ongoing challenges in the world, Apple has once again reported stellar revenue in its latest quarterly results. Here’s a graphical breakdown of how Apple’s finances fared and changed over the quarters and the years.
On Thursday, Apple reported its fourth and final quarter for the 2020 fiscal year. In a year described by CEO Tim Cook as one “defined by innovation in the face of adversity,” Apple saw new all-time records for Mac and Services, which helped boost quarterly revenue to roughly 1% higher than last year.
However, the high revenue occurs without an iPhone release in the period, with iPhone revenue also down in the period. The fact that Apple managed to accomplish this despite lower revenue from its keystone product warrants a closer examination.
What follows is the collection of graphs and charts that AppleInsider has generated based on the quarterly results issued by Apple over time.
Revenue and Net Profit
For the quarter, Apple reported revenue of $64.7 billion, an increase of 1.0% year-on-year from $64.0 reported for Q4 2019. A single percentage gain may not sound like much, but given this occurs at the tail end of a financial year dramatically affected by the COVID-19 pandemic, keeping an even keel or a modest shrink instead of growth would have been acceptable for most industries.
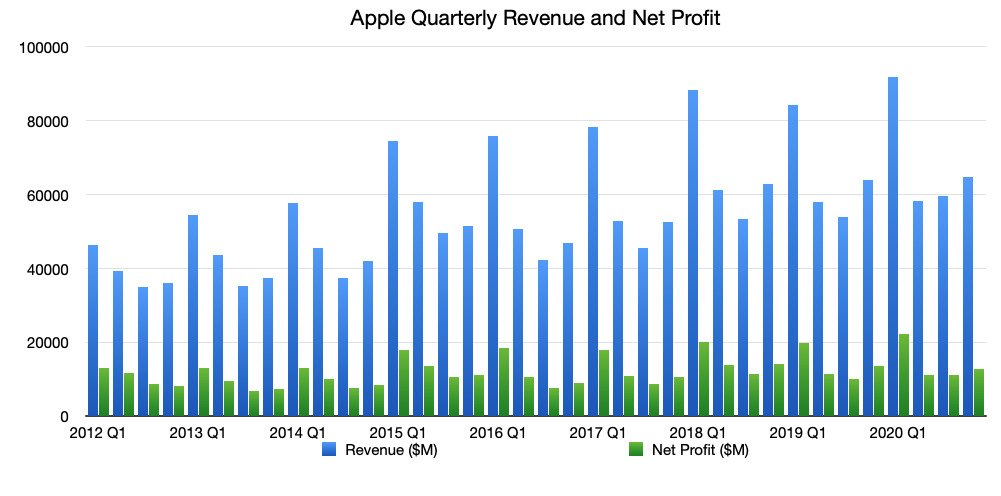
Apple also reported a net profit of $12.7 billion, which is down year-on-year by 7.4% against $13.7 billion. This would seem to be an issue in most years, but again it is expected that costs will rise due to the pandemic, so there’s little to worry about.
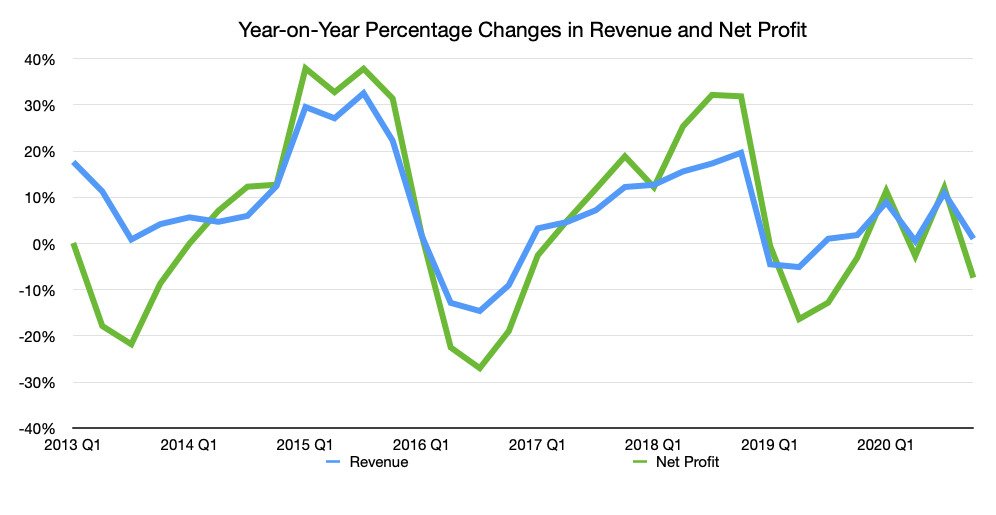
The year-on-year change for quarterly revenue and net profit
While the lines in this chart may be worrying, as Apple is still hovering around the 0% region for the last few quarters, just bear in mind that the year’s events have taken a toll on many companies, as well as its customers. Neither line goes as far down as periods such as mid-2016 where revenue shrank YoY by well over 20%.
Gross Margin
Referring to the net sales minus the cost of goods sold, the gross margin is usually a good indicator of whether it has been an expensive year for Apple or not. The lower the percentage, the lower the proportional profit Apple earns, and vice versa.
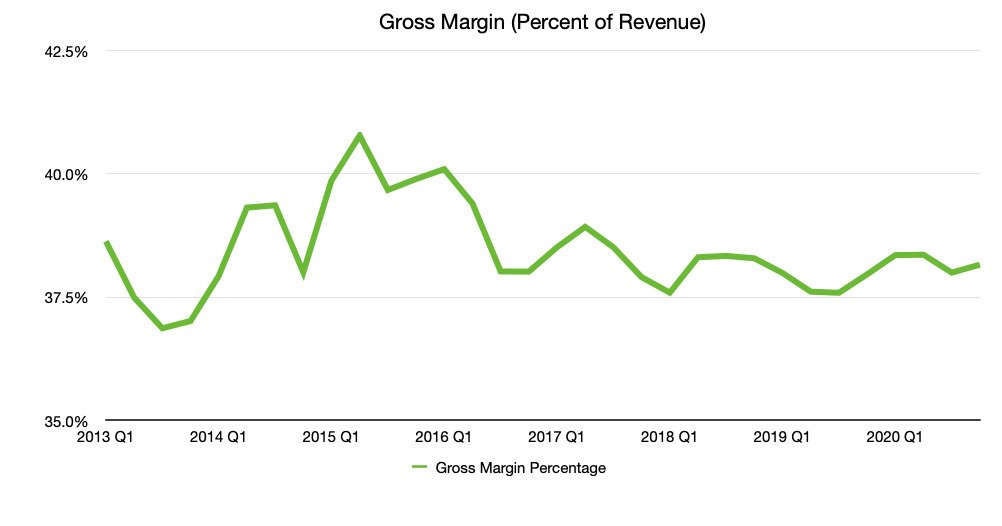
Apple’s quarterly gross margin as a percentage of the quarter’s revenue
For Q4 2020, the gross margin percentage is 38.16%, which is up from Q4 2019’s 37.97%. This is also towards the middle of the range of Apple’s typical gross margin figures, which since Q1 2013 has been between 37% and 40%, with rare exceptions.
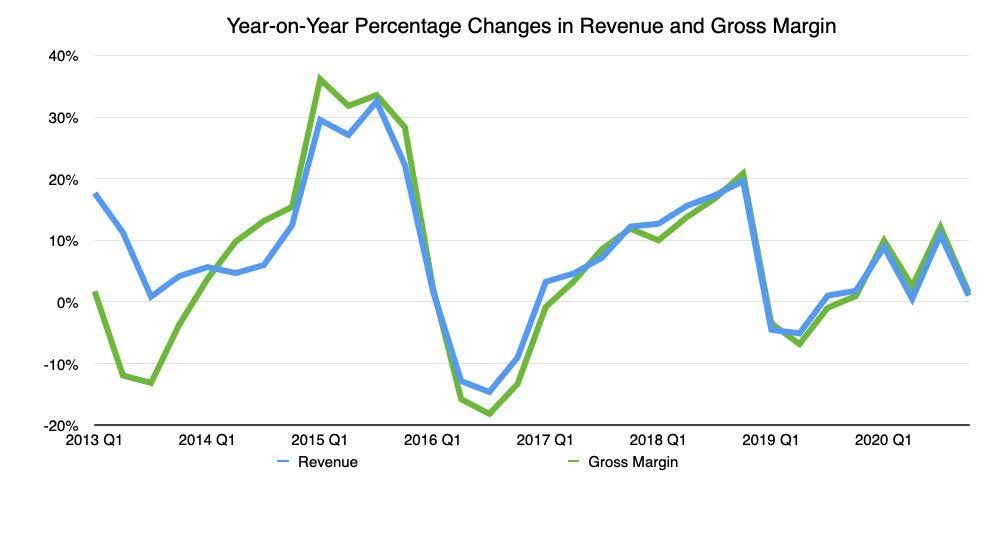
The year-on-year percentage change in quarterly revenue and gross margin
Like revenue for the quarter, there’s a small improvement on last year, but not by much. Despite the reduction in net profit, the gross margin is still quite resilient to change.
Annual revenue, gross margin, net income
As it is the end of the fiscal year 2020, we also have data for a full year of results, which will allow us to more directly compare the company’s fortunes against previous financial years.
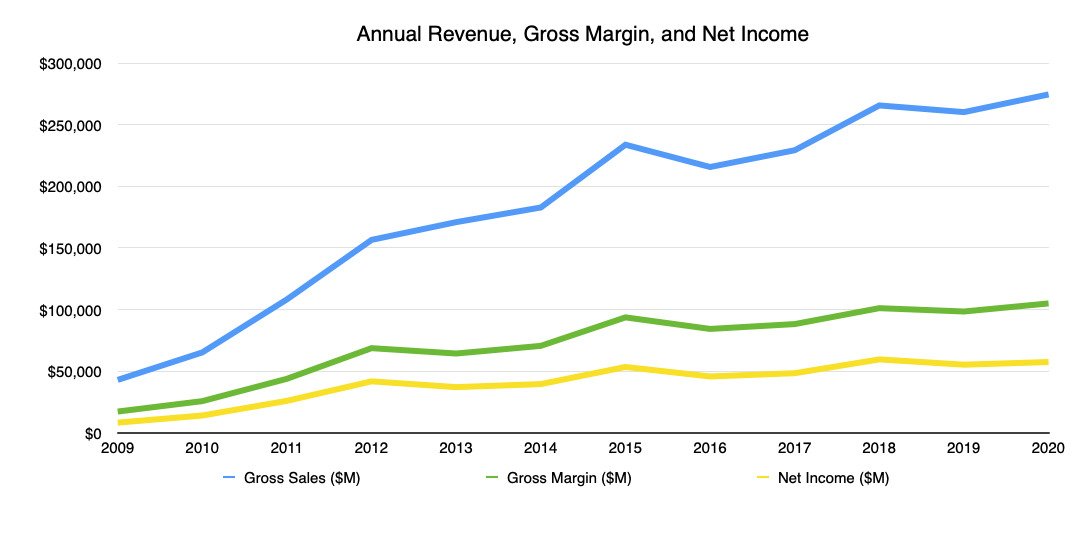
Apple’s annual revenue, gross margin, and net income
The 2020 fiscal year is Apple’s biggest on record, despite the challenges of the year. The company saw gross sales of $274.5 billion, up from $260 billion in 2019, and the previous-highest $265 billion from 2018.
The gross margin value is also naturally the highest since records began, at $104.96 billion against $98 billion in 2019 and $101 billion in 2018.
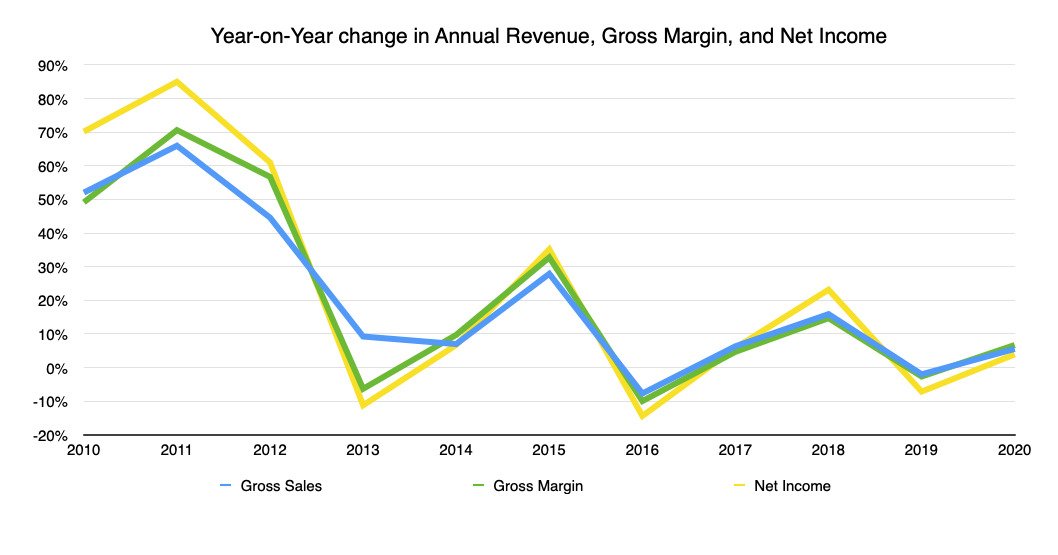
The year-on-year change in annual revenue, gross margin, and net income for Apple
Of the three key values, net income isn’t quite the highest on record with its $57.4 billion, as while it does beat the $55 billion of 2019, it’s still below 2018’s $59.5 billion.
Crucially, all of them are still an improvement on 2019’s figures, which means Apple is continuing to do better when averaged across the year.
Research and Development
As a technology company, Apple obviously has to continue to press forward with developing products. While this largely consists of its more visible product lines, including the iPhone, iPad, Mac, and others, it also has to invest in improving indirect areas, such as operating systems and other software.
There’s also products that Apple is working on that exist in rumors and patent filings but have yet to actually launch. This includes the “Apple Car,” “Apple Glass,” and other similarly-speculated in-development items that could greatly improve Apple’s future revenue.

Apple’s increase in R&D costs over time against revenue
For the quarter, Apple spent $4.9 billion on research and development costs, up from the $4.1 billion of the quarter one year prior. This represents an increase of 21.1% of R&D spending year-on-year, the highest rise in the cost since 2018 Q4’s 25.1% growth.
Units Figures
When divided down onto a product category basis, Apple’s revenue appears to be changing over time to be less reliant on the iPhone. Despite this quarter being the one before the typically prosperous first quarter, it is still quite evident that the trend is continuing for yet another quarter.
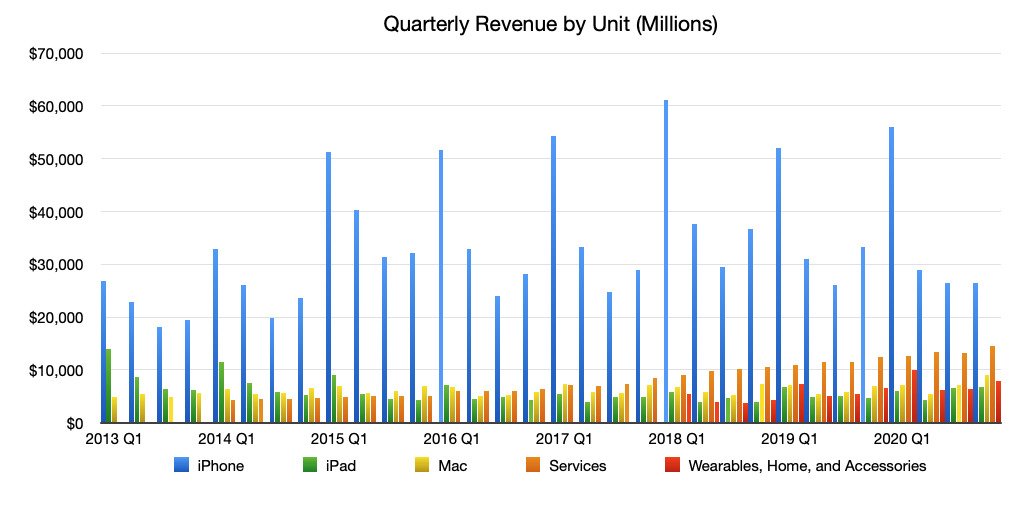
Apple’s quarterly unit revenue
As evidenced by the above chart, it is visible that the iPhone’s typically sky-high bar is slowly getting lower over time. At the same time, the smaller bars for other units are getting larger, seemingly with the gains in other categories helping to outweigh the depreciation in iPhone.
iPhone
For Q4 2020, Apple reported revenue of $26.4 billion, which is down from the $33 billion seen in Q4 2019. While this isn’t as bad as the Q3 2019 result of $26 billion, it does demonstrate there is a downturn for revenue for the product category.
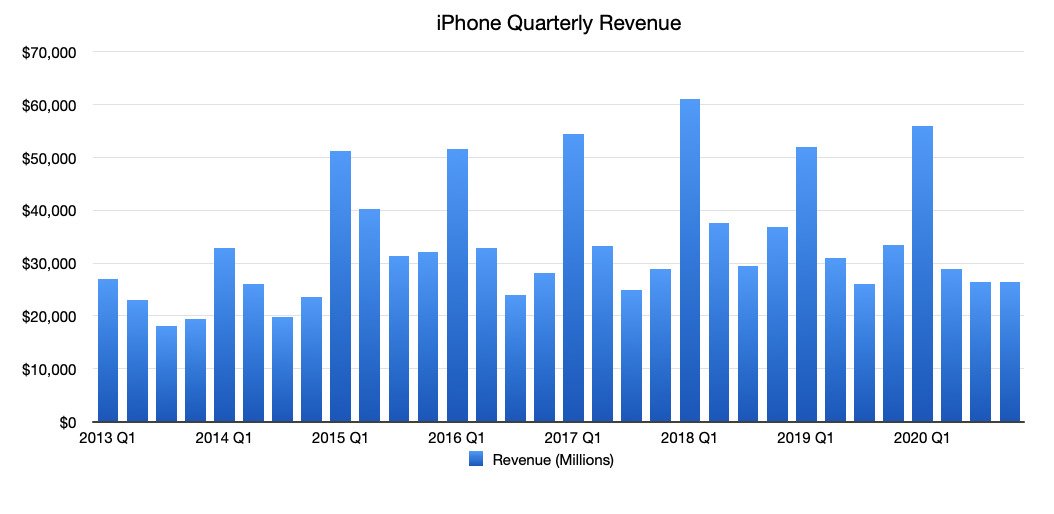
Apple’s quarterly iPhone revenue
Normally, sales trends for Apple has Q3 as the worst quarter before a small increase in Q4 ahead of high Q1 sales, but there’s barely any change in sequential quarters this time. To be more accurate, Q4 2020 reports $26.444 billion, while Q3 2020 saw $26.418 billion.
In previous quarters, the Q4 results would be partially assisted by an iPhone launch in the latter weeks, but Apple’s delayed iPhone 12 launches and releases were pushed to wholly take place in Q4. This would have added a few billion to Q4’s total, but instead that initial sales wave will probably be seen in Q1.
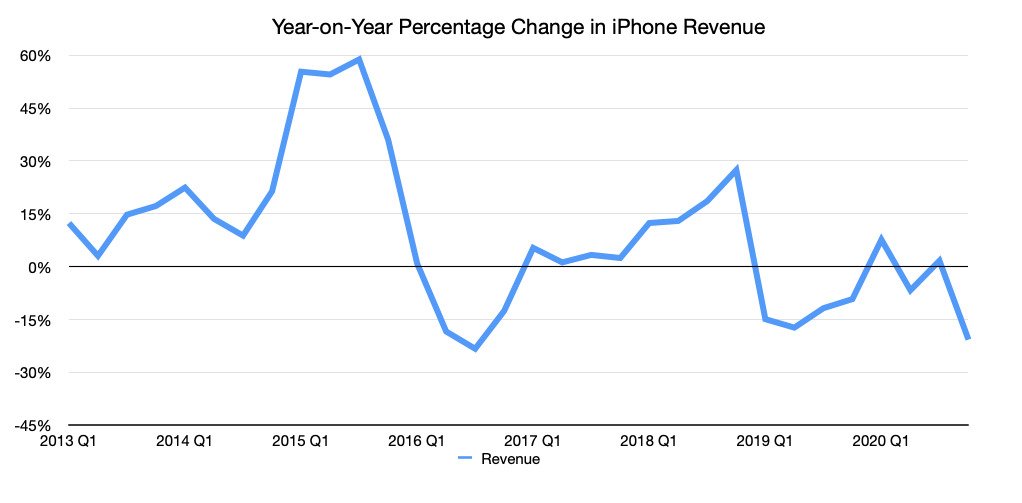
Apple’s iPhone quarterly revenue change on a year-on-year basis
On a percentage change year-on-year basis, Q4 2020 doesn’t look good, with a 20.7% drop from Q4 2019. This works out to be the biggest YoY percentage drop in quarterly iPhone revenue since Q3 2016, which experienced a 23.3% reduction.
iPad
Apple reported iPad revenue was $6.8 billion in the quarter, which is a massive 46% increase over the $4.66 billion reported in Q4 2019. It is highly likely that the iPad benefited from the social distancing and work-from-home measures governments around the world encouraged during the pandemic.
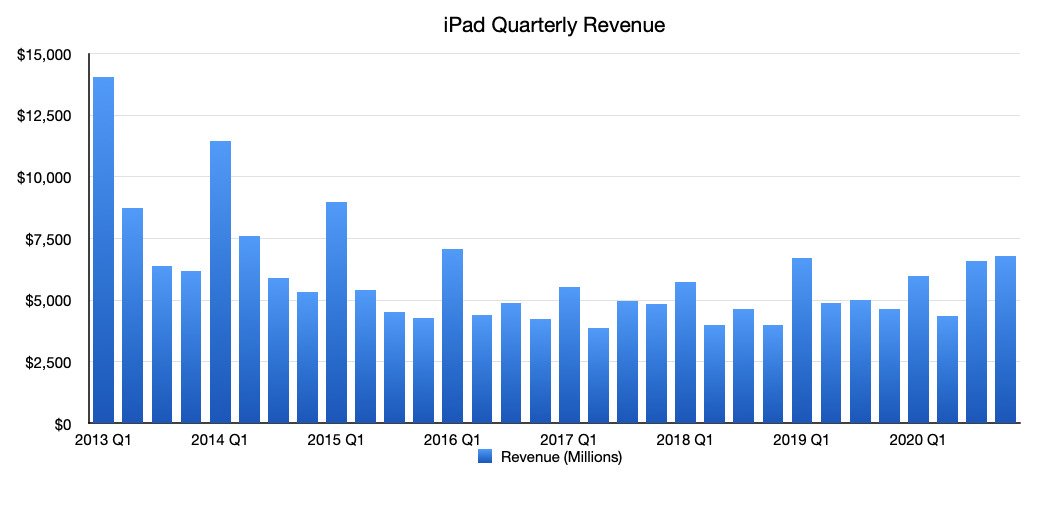
Apple’s iPad revenue per quarter
Apple did launch some iPads during the period, namely the fourth-generation iPad Air and the 10.2-inch iPad, but only the latter was released during the quarter itself, and is unlikely to have made much of an impact.
Mac
The Mac segment enjoyed a similarly buoyant quarter, enjoying a record $9 billion in revenue for the period. This soundly beats the Q4 2019 figure of $6.99, and is a continuation of the improvement seen in Q3 2020.
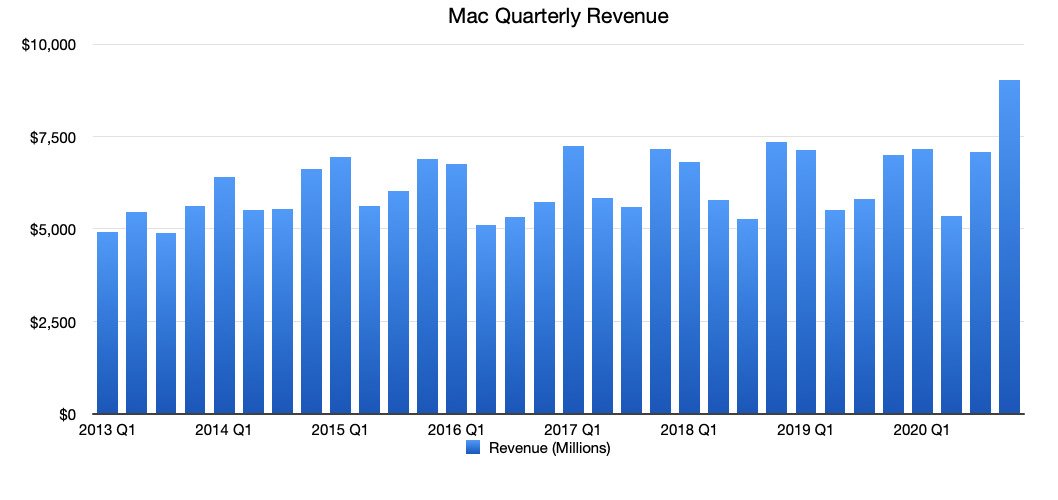
Apple’s Mac revenue per quarter
It is probable that the Mac segment is enjoying the same sort of pandemic-halo benefit as the iPad, but both areas could have done better. In the analyst conference call following the results, Cook claimed there were supply constraints for both areas, indicating there was a higher demand than Apple was able to supply.
Services
The Services business has been a very reliable source of revenue for Apple over the quarters and the years, and at a time when consumers are more likely to use services like the App Store and Apple Music, this quarter is no exception.
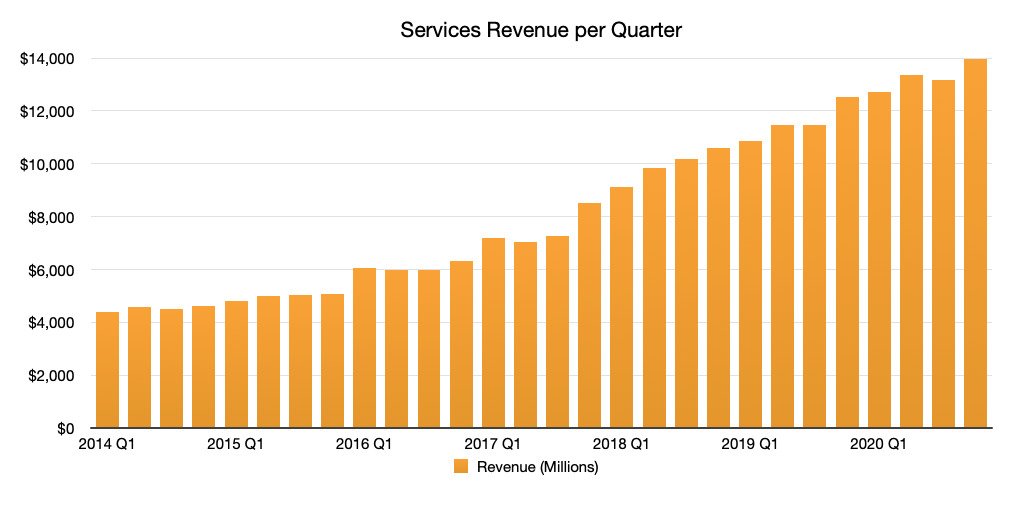
Apple’s quarterly services revenue
Apple reported Services revenue of $14.5 billion, the segment’s highest result so far, and a continuation of the growth trend. Services is also an extremely useful area for Apple as it offers extremely high gross margins of around 67%, making them highly profitable compared to costs.
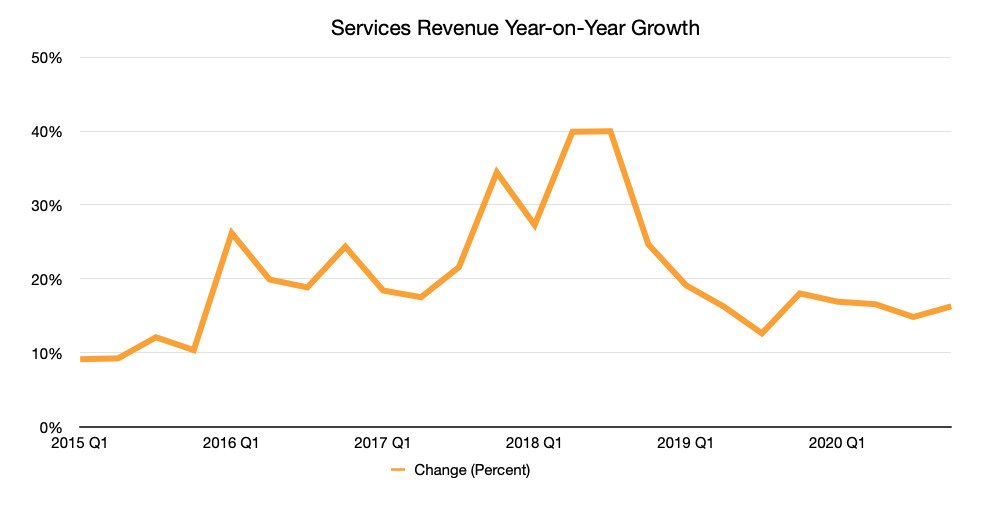
Apple’s Services revenue growth year-on-year
For the quarter, the YoY growth of Services is 16.3%. It still isn’t at its previous 2018 ballpark of 30% to 40%, but it seems to be relatively stable at its current range of between 15% and 19%.
Wearables, Home, and Accessories
Covering multiple product areas not handled by the other four, this group accounts for lots of items, including the Apple Watch, HomePod, and AirPod ranges, among others.
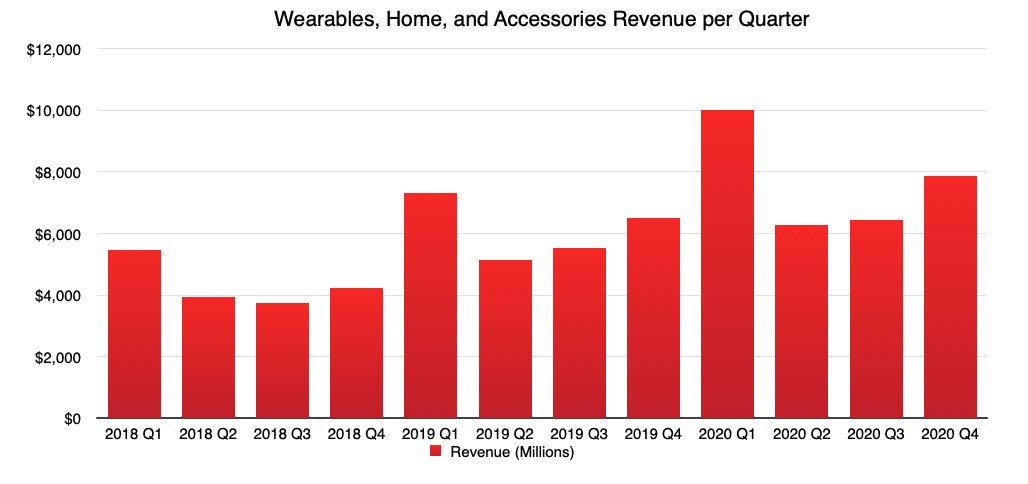
Apple’s Wearables, Home, and Accessories revenue per quarter
For Q4 2020, Apple reports revenue of $7.9 billion, up from $6.5 billion in Q4 2019. While not as high as the record-setting $10 billion Q1 2020, the Q4 value suggests the Q1 2021 figure could reach even higher levels once again.

The year-on-year change of quarterly Wearables, Home, and Accessories revenue
In terms of growth, Q4 2020 saw a YoY improvement of 20.8%. While this seems relatively low compared to earlier quarters, which benefited from the launch of early-generation products to highly-receptive markets, it’s still a highly encouraging figure to see for the relatively young segment.
Operating Segments
On a regional basis, the Americas continues to be Apple’s primary source of income with $30.698 billion, up 4.7% from one year prior. Second place goes to Europe with $16.9 billion, up 13.1 percent, while China is in third with $7.9 billion, down 28.6%.
Japan revenue is up 0.8% at $5 billion, and Rest of Asia Pacific makes up the remainder with $4.1 billion, up 13%.
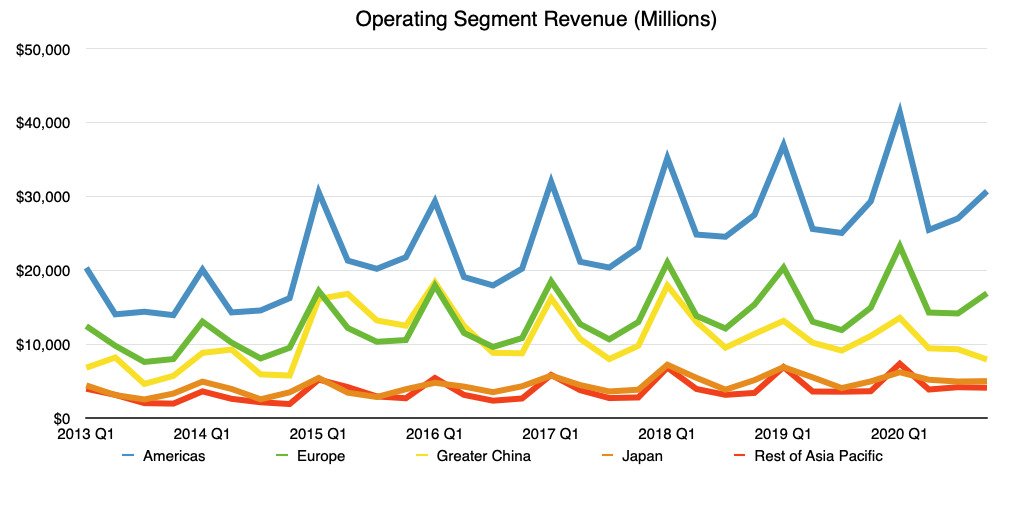
Apple’s operating segment revenue
The considerable drop in revenue for China has been balanced out by improvements in other markets. This has redistributed the contribution percentages of each considerably, to the point that the Americas now provide 47.4% of Apple’s revenue.
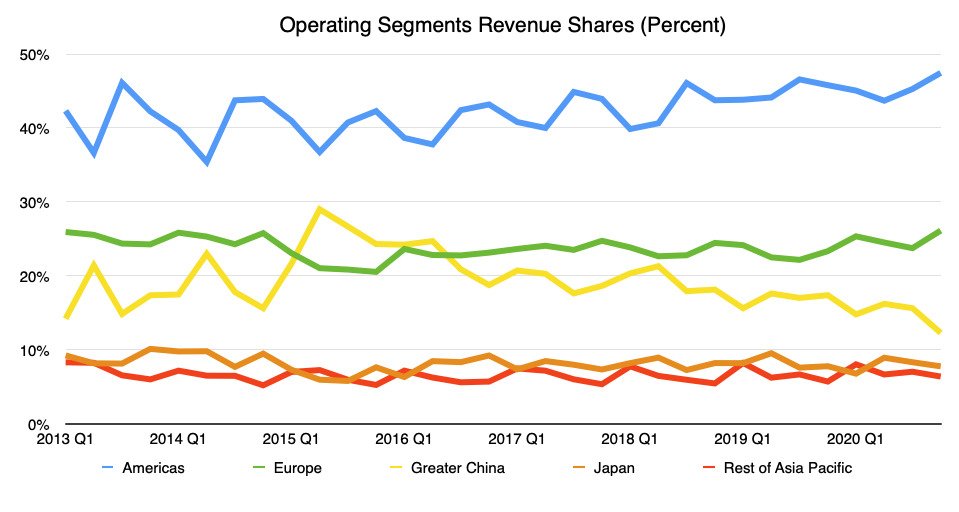
Revenue shares for Apple’s various operating segments
Of the remainder, Europe contributes 26.1%, Greater China hands over 12.3%, Japan does so for 7.8%, and Rest of Asia Pacific equates to a 6.4% share.
Greater China
The sudden drop in Greater China revenue is a major issue for Apple, as such a plunge equates to a revenue drop of $3.2 billion for the region.
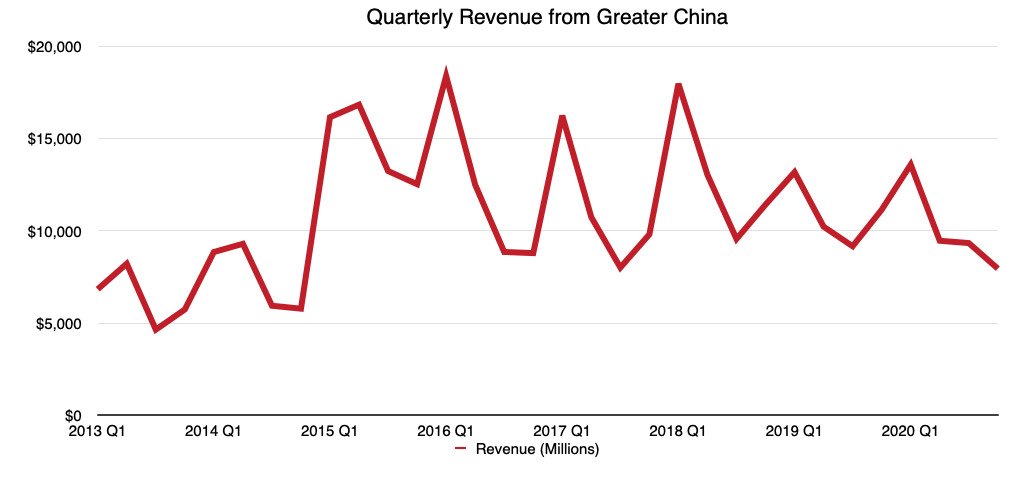
Apple’s revenue per quarter from Greater China
During the conference call, Cook claimed “China is the region that was most heavily impacted by the absence of the new iPhones during the September quarter,” as a reason for why it was so low. Cook continued “Still, we beat our internal expectations in the region, growing non-iPhone revenue strong double digits and iPhone customer demand grew through mid-September.”
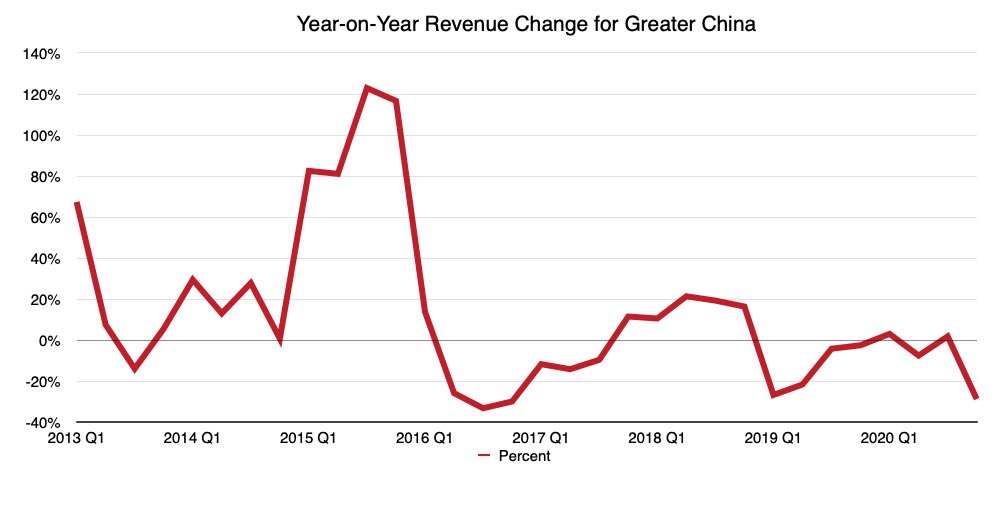
The year-on-year change in quarterly revenue for Apple in Greater China
It seems Cook’s statement on China’s iPhone demand is highly plausible, but it remains to be seen if the demand translates into actual sales. Cook is “confident” the Q4 quarter will grow, and given the shift of a few billion dollars worth of iPhones between quarters, it’s quite likely to do so.
